Category: life

  • More Visual Studio 2010 Performance Testing "Fun"

    This is a continuation of my previous post on the half-baked core features of load testing in Visual Studio 2010.  We had been progressing fairly well, but with some of the new fixes that have gone into the application, we have reached new issues.

    I would like to preface this with our application is by no means great.  In fact, it is pretty janky and does a lot of incredibly stupid things.  Having a 1.5MB viewstate (or larger) is an issue, and I get that.  However, the way that VS handles it is plain unacceptable.

    With that said, I’m sure you can imagine where this is going.  When running an individual webtest each request cannot be larger than 1.5MB.  This took a bit of time to figure out as many of our tests were simply failing.  The best part of this is that we have a VIEWSTATE extract parameter (see #1 on the previous post), and the error we always get is that the VIEWSTATE cannot be extracted.  Strange, I see it in the response window when I run the webtest.  Oh, wait, does that say Response (Truncated)?  Oh right, because my response is over 1.5MB.

    Oh, and that’s not just truncated for viewing, that’s truncated in memory.  Needless to say this has caused a large amount of issues for us.  Thankfully, VS 2010 is nice and you can create plugins to get around this (see below).  The downside is that VS has obviously not been built to run webtests with our complexity, and definitely not bypassing the 1.5MB sized response.

    public override void PreWebTest(object sender, PreWebTestEventArgs e)
            {
                e.WebTest.ResponseBodyCaptureLimit = 15000000;
                e.WebTest.StopOnError = true;
                base.PreWebTest(sender, e);
            }
    

    If you use this plugin, be prepared for a lot of painful hours in VS.  I am running this on a laptop with 4GB of RAM, and prior to the webtest running devenv.exe is using ~300MB of RAM.  However, during the test, that balloons to 2.5GB and pegs one of my cores at 100% utilization as it attempts to parse all the data.     Fun!

    The max amount of data we could have in the test context is 30MB.  Granted, as mentioned earlier, this is a lot of text.  However, I fail to see how it accounts for almost 100x that amount in RAM.

    Thankfully, in a load test scenario all that data isn’t parsed out to be viewed and you don’t have any of these issues.  You just need to create perfect scripts that you don’t ever need to update.  Good luck with that!

    Oh and as an update, for #3 in my previous post, I created a bug for it, but haven’t heard anything back.  Needless to say, we are still having the issue.

    And I realize that we’ve had a lot of issues with VS 2010, and I get angry about it.  However, I want to re-iterate that no testing platforms are good.


  • Windows Home Server 2011 Released

    I was poking around on MSDN, and noticed that WHS 2011 actually went live sometime last month.  Well, you know what that means…time to upgrade!  Unfortunately, there isn’t really an upgrade path, as you need to backup and then restore all your data.  Thankfully, since my instance of WHS is virtualized, no need to do all that work.  Instead I just bring up a separate virtual machine, and then copy the data over.

    I’m sure that I’ll run into issues and various other items.  As I do, I’ll be sure to share them here, so keep an eye on this space.


  • A Better Backup Plan

    For the longest time, I’ve been using Carbonite as my backup provider.  I can’t say that I was ever really unhappy with it, but I was hoping to find something better as my yearly subscription was expiring.  Some of the issues I was trying to move away from:

    • As was previously mentioned, I have a WHS machine and getting Carbonite to work correctly with it wasn’t as easy as I had hoped.  Since Carbonite wouldn’t follow the tombstone files, I was forced to have my system as a single drive configuration.  Not all bad, and since it was virtualized anyways, it didn’t matter.
    • The UI is very slow.
    • While you can backup an “unlimited” amount of data, somewhere around 50-100GB they start to throttle you significantly.  When I recently added our wedding photos (11GB), it was going to take over 4 days to just add the incremental amount.
    • Very vanilla without many options.

    I hadn’t really been shopping around, but when Mozy announced their pricing changes, it sort of peaked my interest to look around again.  I had heard about the Mozy price changes over at TechCrunch, and was reading in their comments about where the various people were flocking to now.  That’s where I found out about CrashPlan, or at least I thought I knew what it was all about.

    Well, my Carbonite plan has about 2 months left on it now, and since I have a fair amount of data to backup (just over 200GB), I figured now was the time to make the move.  I mean, since I had based my upload figures on Carbonite’s speeds, that should just about cover the amount of time.

    And man, am I glad I moved!  There are so many awesome features in CrashPlan that not only am I going to be using it, I’m going get others in the family to use it too.

    First, just like Carbonite, I can pay to have my data up in the cloud.  There are a lot of similar items to Carbonite, but there are some nice advanced options:

    • Easily select which folders you want to upload – Same for both
    • Runs as a service, so you don’t have to be logged in – Same for both
    • Personal Encryption Key – Same for both
    • Follows junctions and tombstone files – Only CrashPlan
    • Can rent a 1TB drive to seed the initial upload (didn’t use, but nice option) – Only CrashPlan
    • Backup sets to have different backup intervals – Only CrashPlan
    • Backs up all file types (unless excluded through filter) – Only CrashPlan
    • No throttling, but can specify client side throttling based on multiple factors – Only CrashPlan

    Mind you, those are just for the basic items that Carbonite offers (did I mention CrashPlan is cheaper too?).  However, CrashPlan also has a ton of other features in case you don’t want to upload to their cloud.  The best part?  If you don’t use the cloud services, you don’t have to pay for it.

    This is a great feature for those that have a lot of storage in an always-on system and want to make a private cloud solution for family members.  It is actually something I’ve been trying to find so that my parents have a trusted cloud-based backup solution on my hardware.

    The even better part?  Based on my testing with my work laptop, it just works!  I have a fairly complex networking structure at home, and while in the office, my laptop was able to connect and start backing up with no issues.  The only difference between what I did, and what my parents will need to do is create an account and “link” it to mine with a backup code that is unique to me.  From there, it starts to sync and they are off to the races.  I can specify a quota for them server side too, so it doesn’t go crazy.

    Overall, I wish I had migrated earlier.  I definitely don’t feel bad in moving away from Carbonite, now that I’ve actually played with the software.  It solves all my initial issues, plus solves an ongoing problem I’ve been trying to fix.  Definitely a huge plus!  In fact, based on my experience, I would definitely consider their business service for an initial startup.  Just sayin’.

  • "Fun" with Visual Studio 2010 Performance Testing

    As I am sure you can tell from the title of this post, we have been having nothing but issues using Visual Studio 2010 on the current solution we are performance testing.  While this is going to be a bitch session, with possible solutions and workarounds we have found, these issues are in no way limited to only Visual Studio.

    As one of my coworkers said, “I’m learning that every load testing solution is shit.”  Sadly, the more you work with them, and the more complex the solution, the quicker you come to this realization.  This becomes even more clear as we are expected to bounce around between different performance testing solutions, being pseudo-masters on a smattering of them.  While it is expensive, outsourcing to someone like Keynote may possibly be the best answer (I have used and work with these guys before, and they are great).

    Without further ado, let me breakdown the issues we’ve been having so far.  I really, really, really hope that this list doesn’t continue to grow as we are already running out of time.

    1. Scripting.  We had a bear of a time with scripting our specific website.  No matter what we did, there was no way to get it to actually work by scripting it with Visual Studio.  The website in general is fairly basic, but is loaded up with a ton of Telerik controls per page (don’t even get me started!).  Each stage of our workflow has a bunch of these controls and then a final submit button that moves it into the next stage.  Scripting with VS always failed on the subsequent AJAX postbacks because it was not correctly parameterizing the values (wasn’t extracting some).  However, this only happened when we scripted all the way to through the final submit.  If we scripted, but did not include the final submit button, the script worked correctly and did not have any of the errors.  Since the Telerik controls have so many forms in the post fixing the parameterization issue by hand would’ve taken hours per page (each workflow has 7 pages and there are 17 workflows).  And we couldn’t figure out how to simply wire up the final submit to the working rest of the script.  No matter what we did we’d always get errors on the final submit POST.  The solution?  Use Fiddler and save the sessions as a webtest.  This has a lot of downsides, such as no parameterization at all and the scripts break pretty easily once any code changes.  Fun.
    2. Load Testing Workflows with NTLM Authentication. The next issue we ran into was with wiring up the individual workflow pieces into one large workflow.  The breakdown was that each part of the workflow needed to be handled by a different user, and the users would log in via NTLM.  The most obvious way to do this was to have a webtest call another webtest.  However, we weren’t able to get that to work.  The next way was to use an ordered test, but that didn’t give us reports into individual page loads.  The final way was to create a load scenario that runs scripts in a specific order, but that would require a lot of controllers among other things.  In our desperation, I even created an MSDN question.  The solution?  We created a plugin that cleared the user’s cookies (even though it should’ve been running as a unique user 100% of the time), and also accessed a server redirect page to force the authentication request.  Thankfully we didn’t go down the road of rolling our own queuing system as that would’ve been painful.
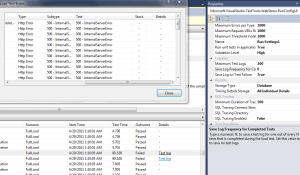
    3. Lack of Test Logs after a Run. Now that we were actually able to run tests, we were having all sorts of issues with results.  Sadly, we weren’t able to actually view the results because VS wasn’t saving them.  Again, in desperation I created another MSDN question.  With VS2010, you are supposed to be able to capture all the results of failed tests, and the select “Test Log” to see what the results are.  Unfortunately, when we run tests it sometimes shows up, and sometimes not.  However, for anything longer than a 15 minute run, ours were 60 mins, we never received any results.  We also get links to the “Test Log”, but they don’t do anything when you click.  The solution?  Yeah, as of now we don’t have one other than running two controllers: one running the full load and another one running individual tests to hopefully see a similar error message.

    I can only hope that there are no other issues.  Hope, hope, hope!


  • Easy XPath Queries

    A guy in the office was asking about a better way to do XPath queries.  Well, since everyone uses Notepad++ (right?!), you can use the following plugins.

    XML Tools

    Libraries

    Restart NotePad++ and checkout the Plugin menu.  Under XML Tools there is now an evaluate XPath Expressions.  Very handy!

  • Large File Transfers

    One of the problems I know I’ve had in the past, especially at work, is transferring large files between two places.  Usually this happens with virtual machines, and developers needing access to the originals.  There has never been a good way around this.  I’ve tried various things: FTP, Dropbox-esque cloud sites, sneaker net, etc.

    However, I stumbled upon a new site that is doing things a bit differently.  Basically their system just maximizes the route between two endpoints and then you send the file directly.  Obviously this isn’t a good choice for upload once, consume a lot items, but if you just need to get things sent once, it could work pretty well.

    The site is called Sendoid, and they have both a web and desktop application.  Looks pretty basic and worthwhile.  I haven’t tried it yet, but it could also work well for distributed backups (house my files on someone else’s computer like my parent’s).

  • Email After 3 Weeks

    The main reason why I dislike taking such long vacations.

    Nothing like 2.8k of unread work email, 457 of which are just in my inbox.  Fun!


  • MSDN Downloader Link

    I hate when I go to MSDN and am downloading a large ISO only for something to happen and the download manager closes.  I don’t have a shortcut on my desktop to it, so it is a pain to find.

    In case this happens to you, here is the link load it back up.

    “C:WindowsDownloaded Program FilesTransferMgr.exe”


  • SQL Dashboard 2005 for SQL 2008

    1. Install the Dashboard by running the msi, which will attempt to install to a default location of Program FilesMicrosoft SQL Server90ToolsPerformanceDashboard. Save the files to the Program FilesMicrosoft SQL Server100ToolsPerformanceDashboard directory instead
    2. Replace performance_dashboard_main.rdl in the PerformanceDashboard folder with the updated version attached below
    3. Open Management Studio and connect to the server and run the SETUP.SQL script (once for each SQL instance you want to monitor) located below and in attachment
    4. From Object Explorer select the server, right mouse click and choose Reports – Custom Reports and browse to find the PERFORMANCE_DASHBOARD_MAIN.RDL file. This report is the only report intended to be directly loaded from SSMS; all other reports are accessed as a drill through off of the main report

    2008 Dashboard Zip

  • IIS Log Analysis

    Some good things to use when trying to do analysis on IIS logs:

    • TXTCollector – This will make all your individual IIS log files into one large file.
    • Log Parser – Write SQL queries against your IIS Log files
    • Visual Log Parser – No command line (but sometimes a pain in the ass to install)!
    • Log Parser Lizard – Visual Log Parser doesn’t want to install anymore, so a new tool it is!
    • Log Parser Studio – Free from MS!

    Some common Log Parser queries:

    select cs-uri-stem as url,
    cs-uri-query, cs-method,
     count(cs-uri-stem) as pagecount,
     sum(time-taken) as total-processing-time,
     avg(time-taken) as average,
     Max(time-taken) as Maximum
    from <logfile>
    group by cs-uri-stem,
     cs-uri-query,
     cs-method
    order by average desc


    select cs-uri-stem as url,
     cs-method,
     count(cs-uri-stem) as pagecount,
     sum(time-taken) as total-processing-time,
     avg(time-taken) as average
    from <logfile>
    where cs-uri-stem like '%.aspx'
    group by cs-uri-stem,
     cs-method
    order by pagecount desc


    select top 500 cs-uri-stem as url,
     cs-uri-query,
     count(cs-uri-stem) as pagecount,
     sum(time-taken) as total-processing-time,
     avg(time-taken) as average
    from <logfile>
    where cs-uri-stem like '%.aspx'
    group by cs-uri-stem,
     cs-uri-query
    order by pagecount desc


    select cs-uri-stem as url,
     cs-method,
     count(cs-uri-stem) as pagecount,
     sum(time-taken) as total-processing-time,
     avg(time-taken) as average,
     avg(sc-bytes),
     max(sc-bytes)
    from <logfile>
    where cs-uri-stem like '%.aspx'
    group by cs-uri-stem,
     cs-method
    order by pagecount desc
    

    UpdateI’m just adding more queries I frequently use, and fixing the formatting.

    select quantize(time-taken,5000) as 5seconds,
     count(cs-uri-stem) as hits,
     cs-uri-stem as url
    from <logfile>
    group by url, quantize(time-taken,5000)
    order by quantize(time-taken,5000)


    select
     quantize(time,3600) as dayHour,
     count(cs-uri-stem) as hits,
     avg(time-taken) as averageTime,
     cs-uri-stem as url
    from <logfile>
    where url like '%.svc'
    group by url,
     dayHour
    order by dayHour
    
    select
    TO_LOCALTIME(QUANTIZE(TO_TIMESTAMP(date, time), 3600)) AS dayHour,
    count(cs-uri-stem) as hits
    from <logfile>
    where cs-uri-stem like '%/page.aspx'
    group by dayHour
    order by dayHour Asc