As I am sure you can tell from the title of this post, we have been having nothing but issues using Visual Studio 2010 on the current solution we are performance testing. While this is going to be a bitch session, with possible solutions and workarounds we have found, these issues are in no way limited to only Visual Studio.
As one of my coworkers said, “I’m learning that every load testing solution is shit.” Sadly, the more you work with them, and the more complex the solution, the quicker you come to this realization. This becomes even more clear as we are expected to bounce around between different performance testing solutions, being pseudo-masters on a smattering of them. While it is expensive, outsourcing to someone like Keynote may possibly be the best answer (I have used and work with these guys before, and they are great).
Without further ado, let me breakdown the issues we’ve been having so far. I really, really, really hope that this list doesn’t continue to grow as we are already running out of time.
- Scripting. We had a bear of a time with scripting our specific website. No matter what we did, there was no way to get it to actually work by scripting it with Visual Studio. The website in general is fairly basic, but is loaded up with a ton of Telerik controls per page (don’t even get me started!). Each stage of our workflow has a bunch of these controls and then a final submit button that moves it into the next stage. Scripting with VS always failed on the subsequent AJAX postbacks because it was not correctly parameterizing the values (wasn’t extracting some). However, this only happened when we scripted all the way to through the final submit. If we scripted, but did not include the final submit button, the script worked correctly and did not have any of the errors. Since the Telerik controls have so many forms in the post fixing the parameterization issue by hand would’ve taken hours per page (each workflow has 7 pages and there are 17 workflows). And we couldn’t figure out how to simply wire up the final submit to the working rest of the script. No matter what we did we’d always get errors on the final submit POST. The solution? Use Fiddler and save the sessions as a webtest. This has a lot of downsides, such as no parameterization at all and the scripts break pretty easily once any code changes. Fun.
- Load Testing Workflows with NTLM Authentication. The next issue we ran into was with wiring up the individual workflow pieces into one large workflow. The breakdown was that each part of the workflow needed to be handled by a different user, and the users would log in via NTLM. The most obvious way to do this was to have a webtest call another webtest. However, we weren’t able to get that to work. The next way was to use an ordered test, but that didn’t give us reports into individual page loads. The final way was to create a load scenario that runs scripts in a specific order, but that would require a lot of controllers among other things. In our desperation, I even created an MSDN question. The solution? We created a plugin that cleared the user’s cookies (even though it should’ve been running as a unique user 100% of the time), and also accessed a server redirect page to force the authentication request. Thankfully we didn’t go down the road of rolling our own queuing system as that would’ve been painful.
- Lack of Test Logs after a Run. Now that we were actually able to run tests, we were having all sorts of issues with results. Sadly, we weren’t able to actually view the results because VS wasn’t saving them.
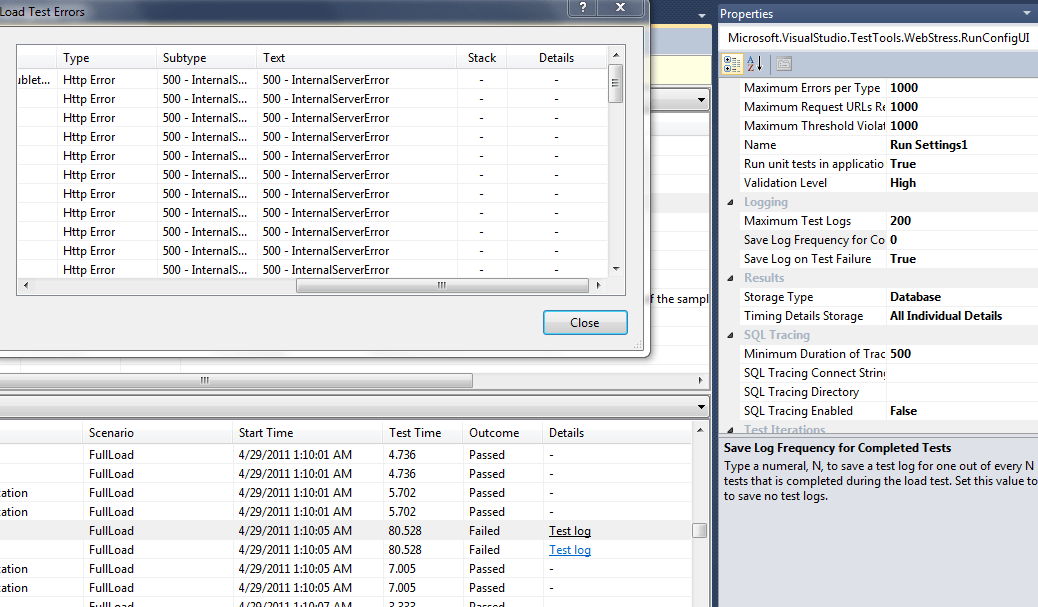
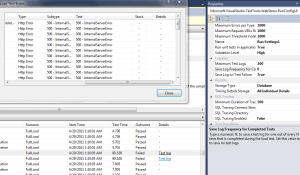 Again, in desperation I created another MSDN question. With VS2010, you are supposed to be able to capture all the results of failed tests, and the select “Test Log” to see what the results are. Unfortunately, when we run tests it sometimes shows up, and sometimes not. However, for anything longer than a 15 minute run, ours were 60 mins, we never received any results. We also get links to the “Test Log”, but they don’t do anything when you click. The solution? Yeah, as of now we don’t have one other than running two controllers: one running the full load and another one running individual tests to hopefully see a similar error message.
I can only hope that there are no other issues. Hope, hope, hope!